U.S. Housing Price Index
Understanding U.S. Housing Price Trends
Welcome to my Housing Price Index project. This website explores how housing price index values have changed over time and how patterns differ across geographic regions in the United States.
The project uses data from the Federal Housing Finance Agency (FHFA) House Price Index to examine long-term housing market patterns.
Project at a Glance
Observations
186,011
Housing price index observations in the dataset.
Locations
472
Geographic locations represented.
Starting Year
1975
Beginning of the dataset’s time period.
Ending Year
2026
Latest year represented in the dataset.
Housing Prices Over Time
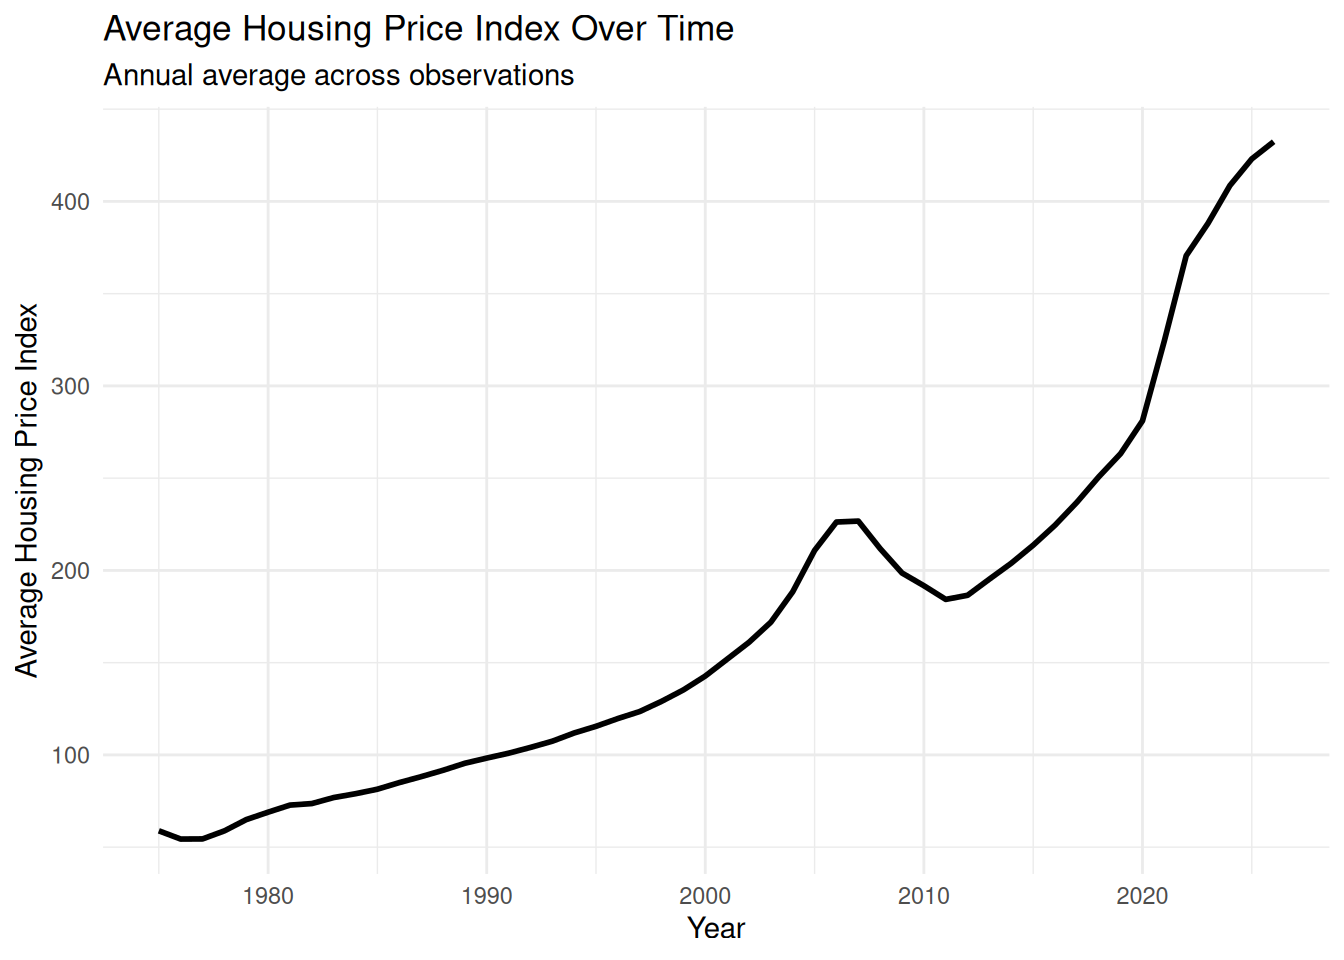
The chart below summarizes the annual average housing price index across the observations in the dataset.
What Is a Housing Price Index?
A housing price index provides a way to examine changes in home prices over time. Instead of focusing on the price of one individual home, an index summarizes price movement across a group of properties.
The FHFA House Price Index is based on repeat transactions and refinancings involving single-family properties with mortgages purchased or securitized by Fannie Mae or Freddie Mac. :contentReferenceoaicite:1
Explore the Project
Use the navigation bar to explore different parts of the analysis.
- Housing Trends — examine changes in the index over time.
- Regional Comparisons — compare patterns across U.S. Census Divisions.
- Housing Stories — explore several patterns found in the data.
- Market Insights — examine summary measurements and variation.
- Data Explorer — look more closely at the underlying observations.
- About — learn about the project, creator, and data source.