Market Insights
Market Insights
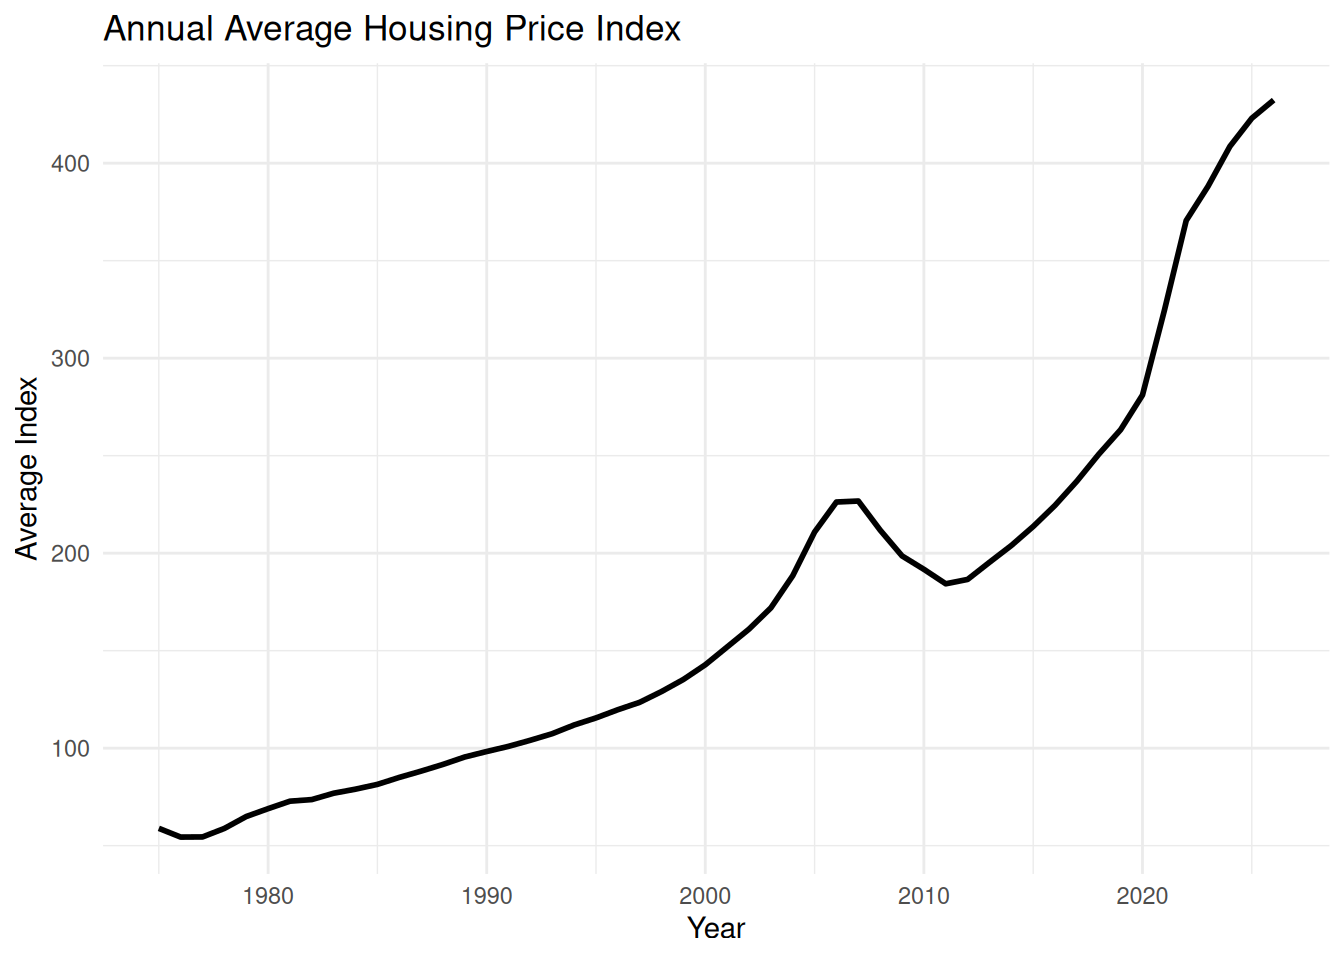
This page summarizes several characteristics of the housing price index dataset.
The goal is to move beyond a single chart and examine the size, time period, and variation represented in the data.
Key Numbers
Observations
186,011
Total observations.
Locations
472
Unique locations.
First Year
1975
Earliest year.
Last Year
2026
Latest year.
Annual Average
How Much Do Values Vary?
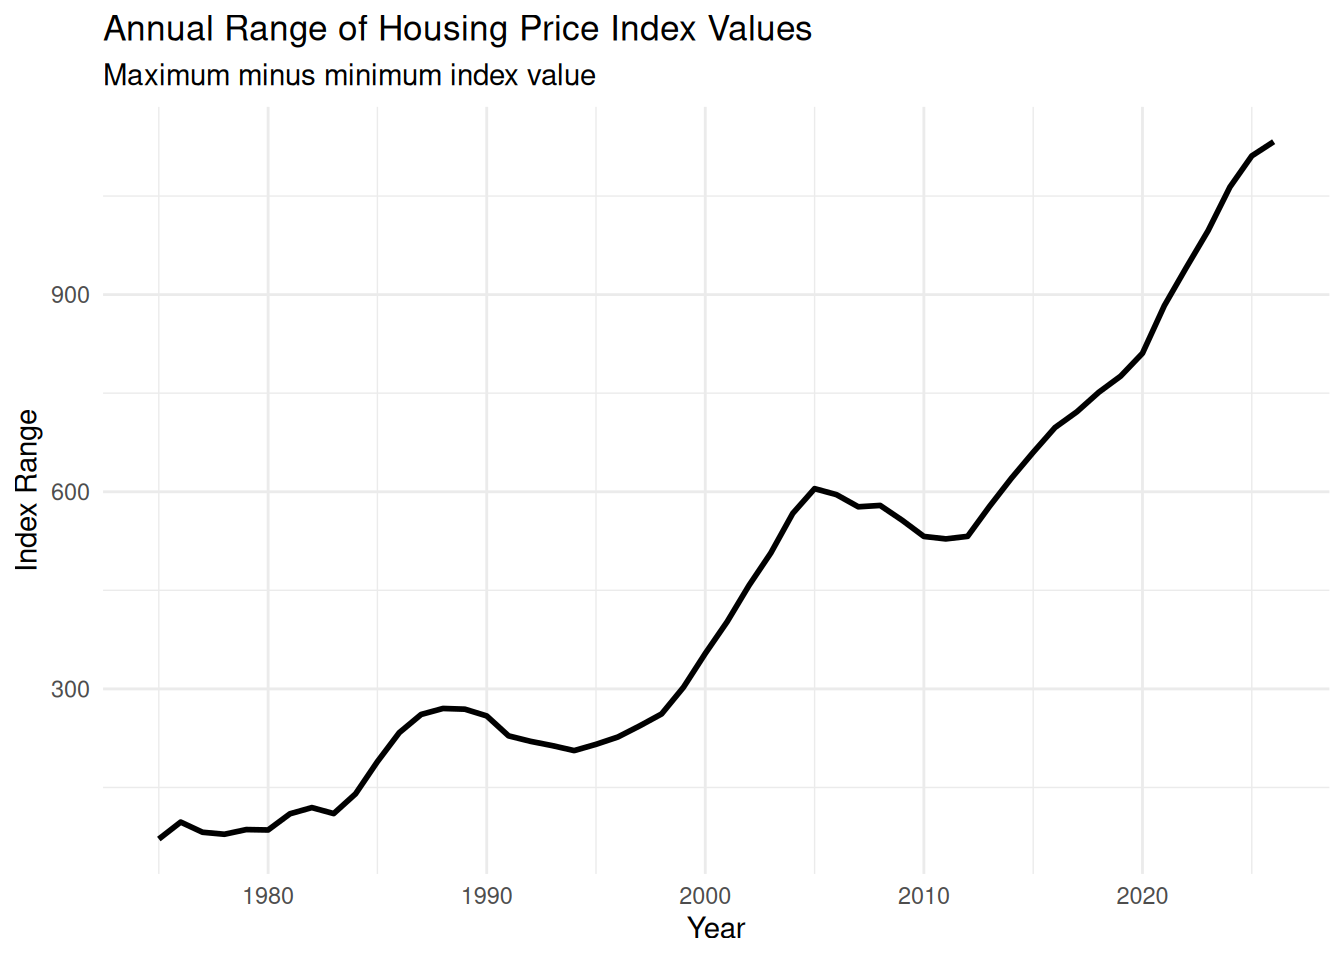
The range measures the difference between the highest and lowest index value recorded within each year.
How Should We Interpret This?
A larger range means that the index values represented in the data were more spread out within that year.
The range does not tell us why the differences occurred. It simply provides a way to describe variation in the observations.
Why This Matters
Summary statistics can help us identify patterns that are not immediately obvious from individual observations.
Use Data Explorer next to examine the underlying rows that produce these summaries.