Housing Stories
Housing Market Stories
Data becomes more useful when we can turn numbers into questions and observations.
This page presents several stories that can be explored using the housing price index data.
Story 1 — Housing Prices Change Over Time
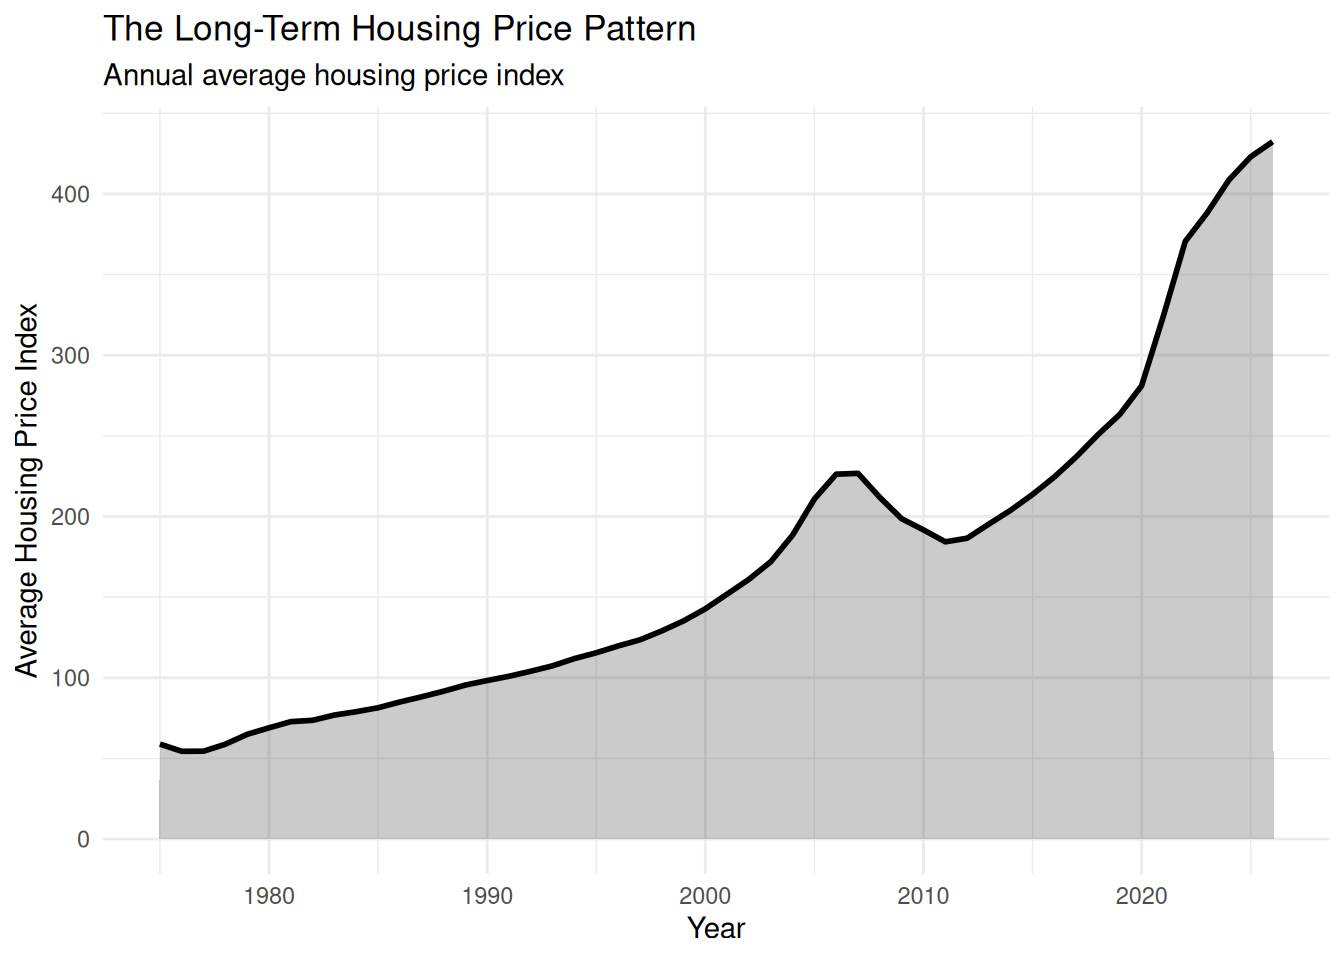
The first story is about long-term change.
The annual average housing price index provides a simple way to see how index values move across the years.
What does this tell us?
The chart shows the broad movement of the index across the time period represented in the dataset.
Rather than focusing on a single month or location, the annual average provides a high-level view of the data.
Story 2 — Location Matters
The second story is about geography.
Housing price index values can vary between locations, meaning that looking only at an overall average may not show the full picture.
The Regional Comparisons page examines this idea by comparing U.S. Census Divisions.
A question to consider
If two regions experience the same general direction of change, do they necessarily experience the same magnitude of change?
The regional chart allows us to investigate that question.
Story 3 — One Dataset, Many Questions
The third story is about how the same dataset can answer different questions.
We can use the data to examine:
- Change over time
- Differences between locations
- The number of observations available
- Variation within a year
- Differences between seasonally adjusted and non-seasonally adjusted values
This is why the project includes multiple pages rather than relying on a single visualization.
What Should We Investigate Next?
Use the other pages to continue exploring:
Housing Trends
Look at long-term changes.
Regional Comparisons
Compare geographic patterns.
Market Insights
Examine summary measurements and variation.
Data Explorer
Look directly at the underlying observations.
The goal is not just to look at a graph, but to use the data to ask better questions.