Data Explorer
Explore the Dataset
The visualizations throughout this project are based on the observations in hpi_master.csv.
This page provides a closer look at the structure of that dataset.
What Is in the Dataset?
Each row represents a housing price index observation for a particular geographic location and time period.
| Variable | Description |
|---|---|
hpi_type |
Type of housing price index |
hpi_flavor |
Index category |
frequency |
Frequency of the observation |
level |
Geographic level |
place_name |
Name of the geographic location |
place_id |
Geographic identifier |
yr |
Year |
period |
Month or quarter |
index_nsa |
Non-seasonally adjusted index |
index_sa |
Seasonally adjusted index |
rstderr |
Relative standard error when available |
note |
Additional information about an observation |
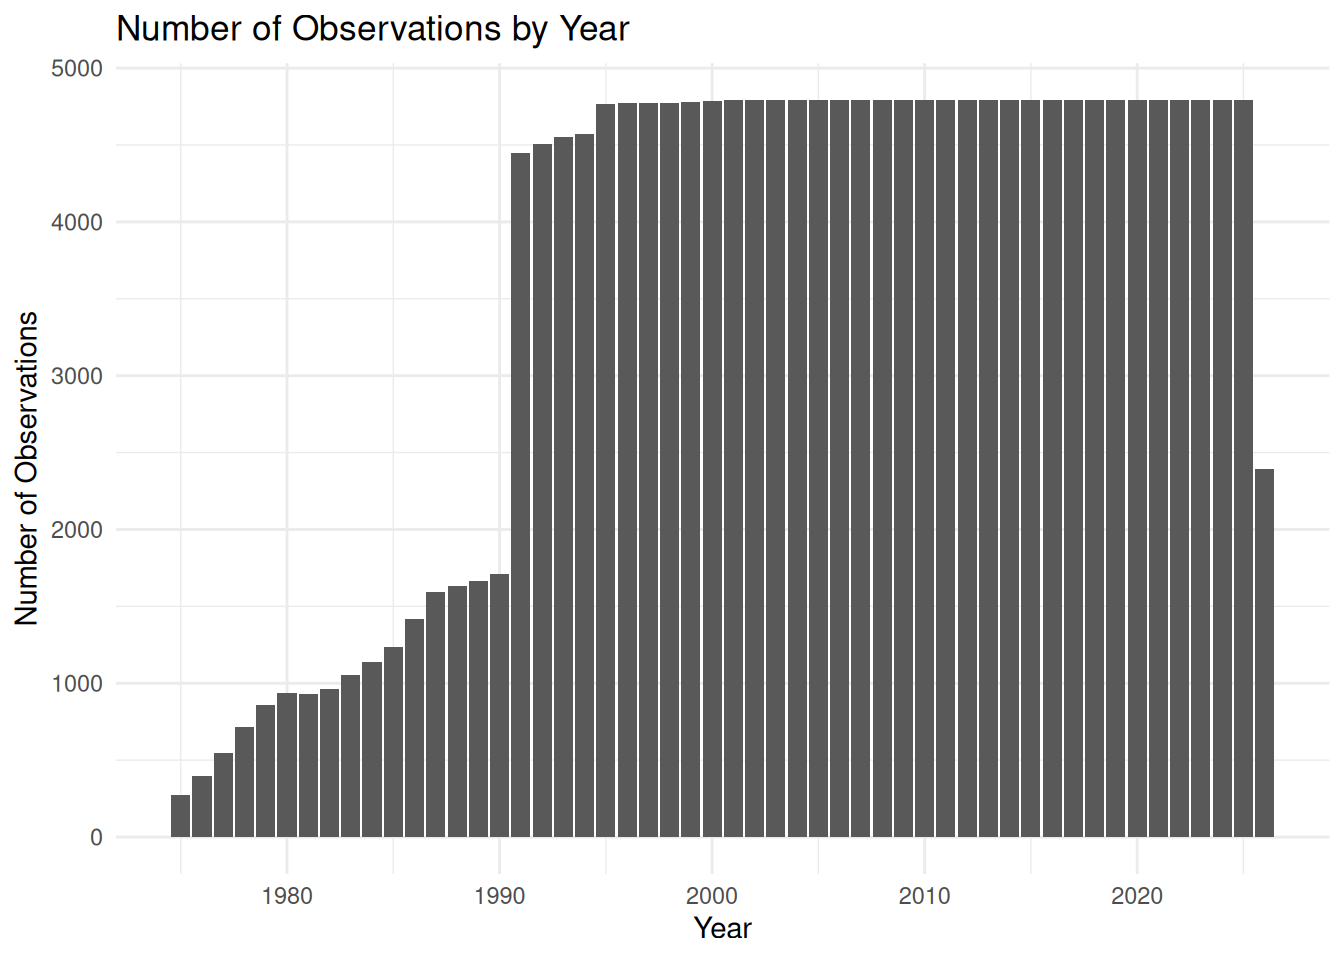
Observations by Year
The number of observations can vary across years.
Recent Observations
Here are 25 observations from the most recent years in the dataset.
# A tibble: 25 × 5
   place_name                     yr period index_nsa index_sa
   <chr>                       <dbl>  <dbl>     <dbl>    <dbl>
 1 East North Central Division  2026      6      393.     383.
 2 East South Central Division  2026      6      430.     420.
 3 Middle Atlantic Division     2026      6      424.     414.
 4 Mountain Division            2026      6      620.     610.
 5 New England Division         2026      6      464.     452.
 6 Pacific Division             2026      6      475.     466.
 7 South Atlantic Division      2026      6      476.     467.
 8 West North Central Division  2026      6      435.     425.
 9 West South Central Division  2026      6      434.     426.
10 United States                2026      6      452.     443.
# ℹ 15 more rows
Why Explore the Raw Data?
Charts are summaries. Looking at the underlying observations helps us understand where those summaries come from.
For example, we can examine:
- Which locations are represented
- Which years contain observations
- How many observations are available
- How seasonally adjusted and non-seasonally adjusted values differ
This page connects the individual observations to the larger patterns shown throughout the project.